A CORPORATE SPARK
§ The Historical Background
We will now go way back, back into time itself(that is just a metaphor, not physically possible. You will see why).
Picture 20th-century Europe, particularly Germany. Every country is fighting tooth and nail to be at the forefront of the industrial revolution, and of course, Germany does not wish to be left behind. And the Prussian Empire makes sure of it1.
From 1815 to 1871, Germany saw extremely rapid industrialisation. Every industry was booming, except the lightbulb industry. Why? It was because lightbulbs at the time were terrible compared to the ones we have today2.
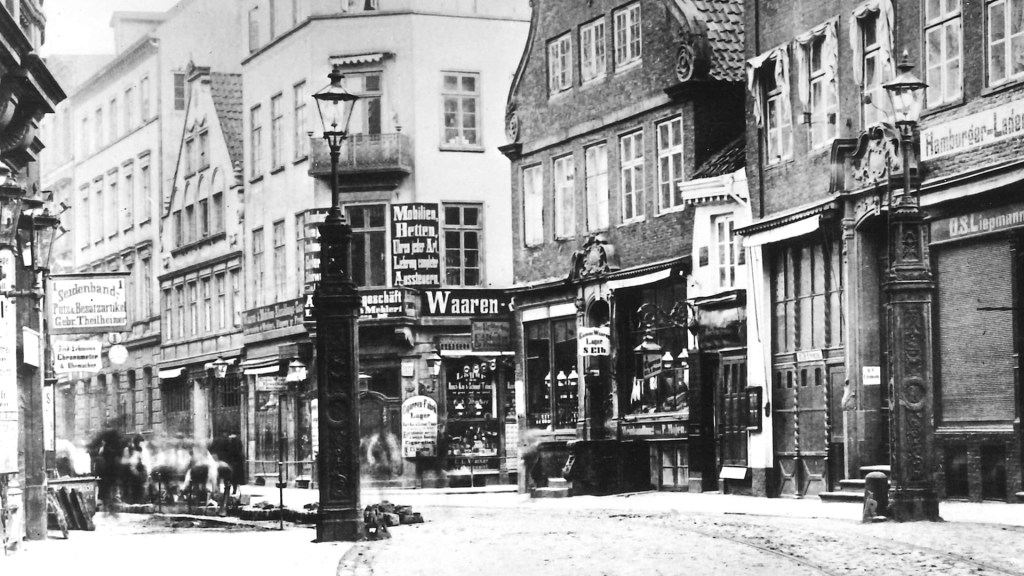
Most of the street lighting consisted of gas lamps and oil lamps3,4. Both had major problems. The first was of danger. Both operated on highly inflammable material not in controlled environments. The second was lamination intensity, which was very low. The third was manpower, which was needed to daily refill oil lamps with fuel and gas lamps with gas. It was obvious – a better solution was needed. And there was one – electric lamps.
Electric lamps solved these two problems, but also raised another one: cost. So, after petitions from multiple influential individuals in Germany, including particularly the industrialist Werner von Siemens(1816 – 1892)5,6, the Kaiser of Germany (King Wilhelm I)7 decided to set up a scientific research institute named the PTR (Physikalisch-Technische Reichsanstalt)8 in 1887. The shorter purpose was, of course, light bulbs, but the larger aim was to keep science at the forefront of German industrialisation. The PTR was also the world’s first state-funded research institute. Its yearly budget was 263,000 Goldmark, roughly $2.15 Million in today’s money8,9.
And with that, Germany was all set to solve the problem of light bulbs.
Unknowingly, this initiative would ignite a revolution in modern physics.
§ Blackbodies and the Ultraviolet Catastrophe
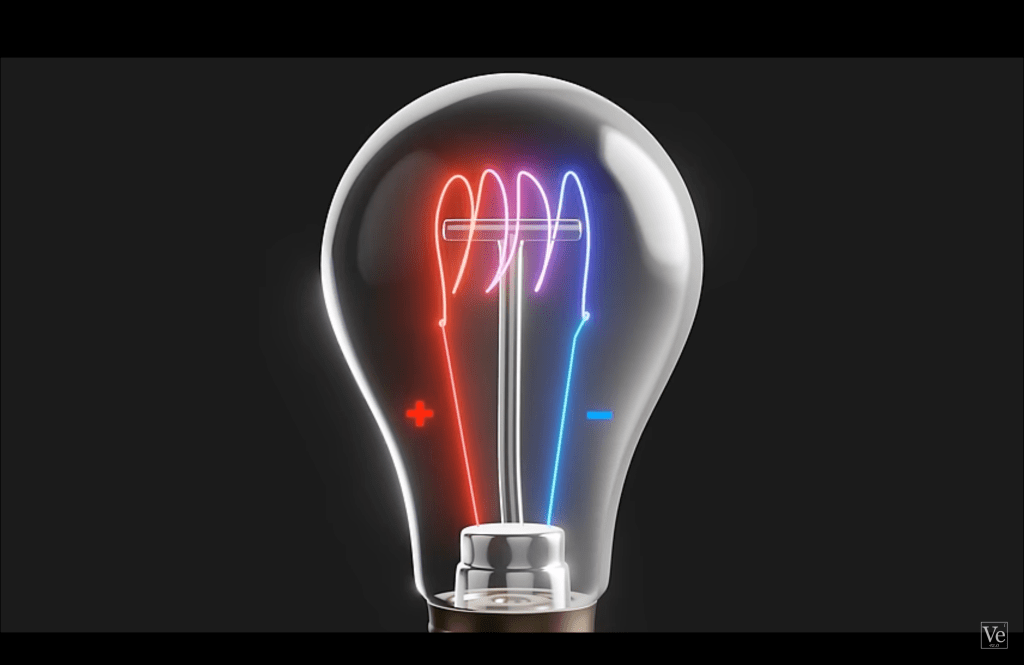
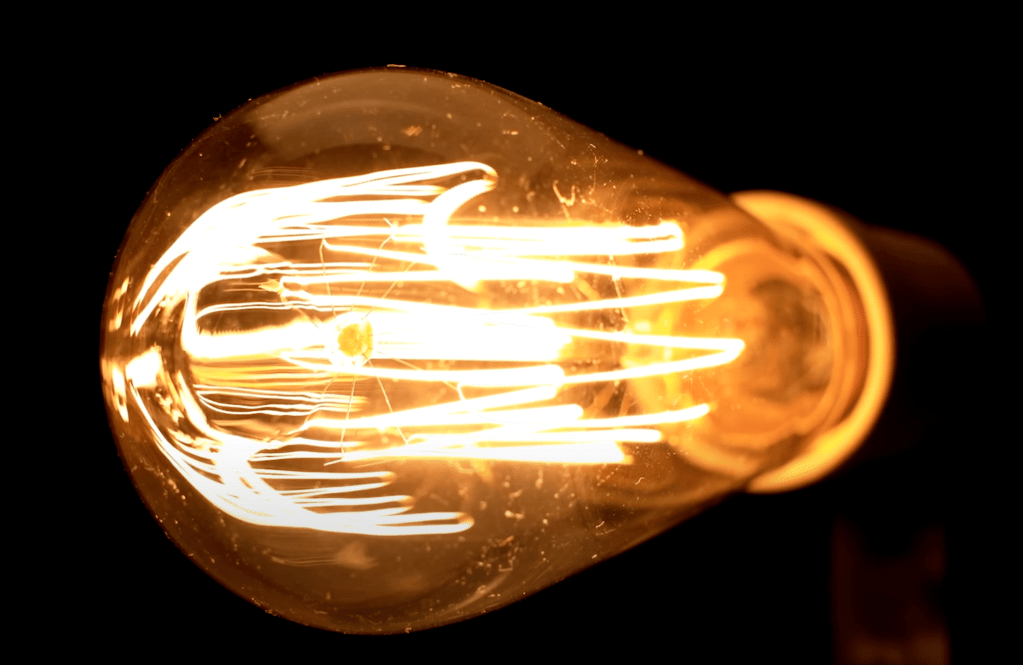
At the PTR, research was being conducted on the best materials for the filament of a light bulb. The reason is that light bulbs are terrible light emitters. There is a filament, and when current is passed through the filament, it gets so hot that it glows. That means, only a negligible fraction of the energy emitted by a lightbulb is in the form of light – the rest is dissipated as heat.
Now the obvious step is to figure out how different metals react to exposure to heat, and how the radiation of light and heat is affected based on temperature. And the research began, and researchers at PTR found out something very peculiar.
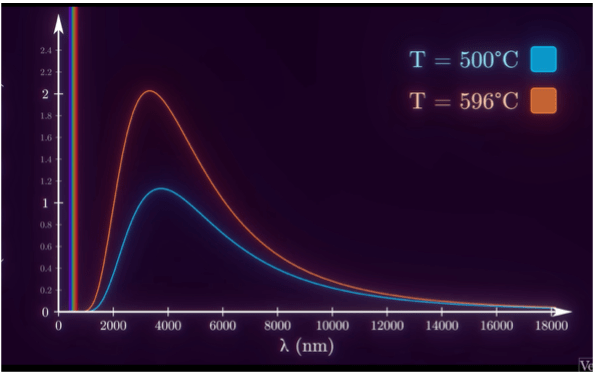
At low temperatures, all metals showed their characteristic spectrum of radiation, mostly in the infrared region. But above about 500°C, something different happened. All metals, regardless of chemical composition, showed the same; every material started to glow in the same way. The hotter the object, the more energy is emitted at every wavelength. It was as if the objects were following some law of nature. And it indeed did. Wilhelm Wien in 1893 studied these radiations and drew an experimental curve, which we now call the Wien’s Displacement Law10.
Here are the simple postulates –
- As the temperature rises, the peak of the curve shifts to the left
- At higher temperatures, the intensity of emitted radiation is higher at every wavelength
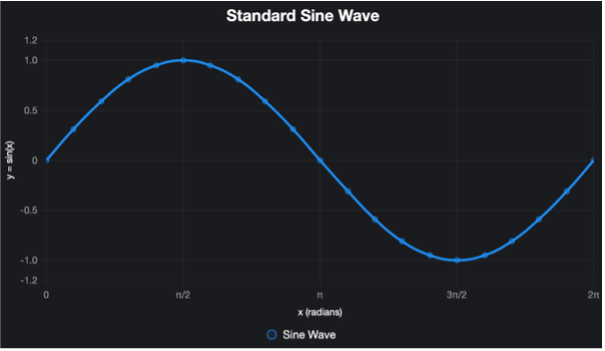
- An example curve(Ignore this right now, this is just for reference. An explanation will be offered shortly) –
Now, all of this is very fascinating stuff, but we still have absolutely no clue whatsoever as to why this happens. Luckily, just like us, even scientists were unhappy. So, to understand why materials show the same distribution of emitted radiation and distribution of light at high enough temperatures, and why Wien’s curve looks the way it does, physicists invented possibly the most important invention of the 19th century – an idealised black body.
Now the term blackbody was coined by Gustav Kirchhoff in 1860 while formulating laws of thermal radiation11. The actual blackbody was invented by Wilhelm Wien and Otto Lummer in 1895 at the PTR9. So let’s start.
First of all, we ought to understand why all materials follow the same light distribution at high temperatures. To answer that, let me ask you a question. On a beach, there are multiple plastic reclining chairs. Many of them are not covered by umbrellas. As you sit on them, you realise how hot it is, but you think about it. All day, that chair is exposed to direct sunlight. The fact that the chair got hot means it absorbed the sunlight(which is obvious). But now, the question is, why does the chair not evaporate if the temperature rises every second the chair is exposed to sunlight? Sounds crazy? It is, because the answer is simple – the only way it can happen is if the chair also emits the radiation it receives. Some may confuse it with reflection – reflection means bouncing the sunlight off the surface of the chair, while emitting means absorbing and re-radiating the light back. When you reflect, the wavelength is conserved, which is why you are able to see anything. Radiation means producing that light from within yourself. The wavelength doesn’t need to be the same as that which was absorbed, meaning it won’t necessarily be in the visible region. Now, the chair was a very random example, but it tells us something. Everything – apples, houses, bikes, planes, tables absorbs and emits the radiation they receive!
Just to be clear, all the radiation talked about here is thermal, not radioactive.
But, if they do emit radiation, why can’t we see it? It’s because the temperature is super low. At lower temperatures, the emitted radiation has its wavelength in the region of non-visible light(mostly infrared). Now you can’t see infrared with the naked eye, but use an infrared camera. Everything the camera sees turns red or orange, or yellow, because they emit radiation – only at different intensities and wavelengths.
This is also why metals at low temperatures all show their characteristic reflected colour, but at high temperatures, they show colours like orange, red, or yellow.
Now, in order to study any real-world phenomenon, the classic physicist thing is to study the ideal situation. Now, what is that in this context? That would be something that perfectly absorbs and emits all radiation it receives. But if an object absorbs every radiation it receives and reflects nothing, it would mean the colour of the object would be….black. And a body which is black and follows such ideal behaviour would be…… black! Now, at the time, no one knew examples of perfect idealised black bodies in nature, only on paper. But today, we know a very popular example – a black hole.
Now think from the lens of a late 1800s Physicist. How would you build such a body? Scratch that, it has been done by Wien and Lummer in 1895. Their solution? Make a box. Inside the box, paint all the walls black, and make a very small hole in any one of the holes of the box. It would look something like this (2D Representation) –

How it works is simple. Any wave that enters(remember, all the phenomenon we see here is a result of the classical understanding of Physics – the Quantum Theory still has not been developed and thus, every form of radiation – light, UV, IR all are to be considered as waves) the body through the hole bounces around walls of the body (by reflection), and after enough reflections gets lost inside the body. The outer walls are non-reflective because of the black colour, and any wave entering and exiting through the hole is nearly impossible, so what we receive by our very definition of a black body is a black body.
Now, take any one wall of the black body. In those walls, the atoms vibrate quite vigorously. These atoms, due to their vibrations, produce electromagnetic (EM) waves. Now, on the atomic scale, it is because of the electrons vibrating due to their charged nature and producing EM waves(by Maxwell’s equations), but the structure of the atom was still unknown at the time. All that was known was that the smallest fundamental constituent of matter is an atom, which, on vibrations, produces EM waves. Now, although most textbooks would refer to them as atomic oscillators or just oscillators, to keep things simple, we will simply refer to them as atoms.
Now there are billions and billions of atoms within the black body, which results in a lot of chaos. But let’s take a closer look.
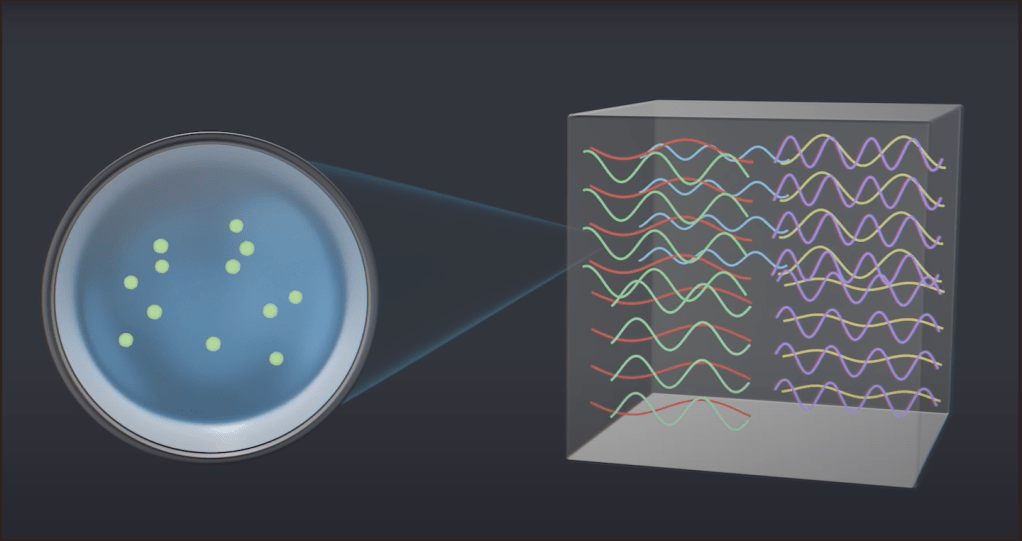
Take a look at these pictures below. When atoms from one wall produce EM waves due to their oscillations, these waves travel to the opposite walls, from where they either bounce back or interfere with the EM waves that have been produced from the atoms in that opposite wall. In both cases, what forms is something called a standing wave. Standing waves don’t travel in space; they just stay in place. Imagine it as if the crests and troughs just go up and down from their respective positions.
Give some time, and only these standing waves remain in the entire body. So, a sort of order emerges from the chaos. It is these waves that are detected coming out of the small hole of the black body, or, the better words, being radiated from the black body.
Now comes the interesting part. According to the classical theory of waves, the energy of a wave is independent of its frequency or wavelength. It is only a factor of its amplitude. Now, in a black body, there are billions and billions of standing waves that have been set up. Some have high amplitude, some have low amplitude. How do you find out the average energy each wave has(not the average of all waves, average energy an individual wave has)? Now, when you have a very large data set and you want to approximate things, what do you use? That’s right, statistics. And there is a perfect way to understand this12.
Imagine three tubes. Now we take a jar of water(let’s assume we have ample amounts of water to conduct this experiment). We blindfold ourselves and randomly pour any amount of water into all three tubes. Now, remove the blindfold and check the tubes. Which will have the most amount of water? That’s obvious; it can be any tube, given there is no bias. Now take another set of these tubes and conduct the same experiment. Again, which tube will have the highest amount of water? It can be any tube. This may seem stupid, but watch what happens now. What if I make it an infinite set of tubes? In each set, a random amount of water was filled in each of the tubes. Now here is the question – if we average out the amount of water in the first tube of every set and pour it into another tube, how much will that be? Let’s call it x. Do the same with the second tube from each set. The question is this: Will the amount of water in the second tube be more than or less than x? Remember, there is no bias, so it can be anything. But given we have an infinite amount of sets, some with the second tube having more water than the first, and some with the first having more than the second, should it be any different from x? No, it won’t be! It will be exactly x. And the same will be for the third tube. Just because we did it for the first tube in the beginning does not mean the other two tubes will be any different. All three tubes have the same amount of water – x, even though every individual set differs from the other. This is called the equipartition theorem.
Use this analogy for the waves. There are billions and billions of waves, each with a different amplitude. But if we use the equipartition theorem, we see that each wave will have the same amount of average energy. Let’s call it Eo.
Now comes the crazy part – what is the total energy inside the black body? Remember, the black body is untouched – these waves were produced by the walls of the blackbody itself, not by some form of stimulation. If you count up billions and billions of waves and their energies, the net energy will be… infinity. This is not the ultraviolet catastrophe. I mean, it is a catastrophe, but not the ultraviolet one. Remember the graph a few pages back? If we draw a similar curve with wavelength and intensity, the graph will be –
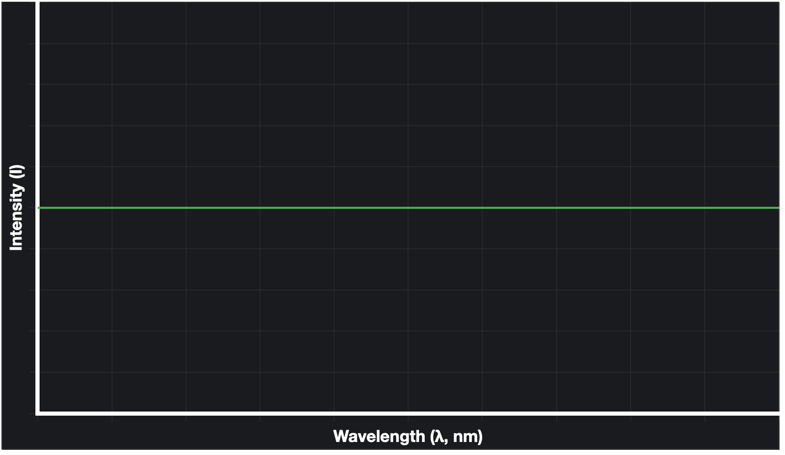
Now the total energy is infinity according to this explanation, but the reason the graph looks this way is because remember, energy is directly proportional to intensity, and that energy is a factor of amplitude, independent of the wavelength. Thus, at every wavelength, the detected intensity is the same.
Now, how do we get to the ultraviolet catastrophe? First of all, why even get to it? The reason is that the actual graph has a curve, not a straight line. So the only logical next step is to get to a curve.
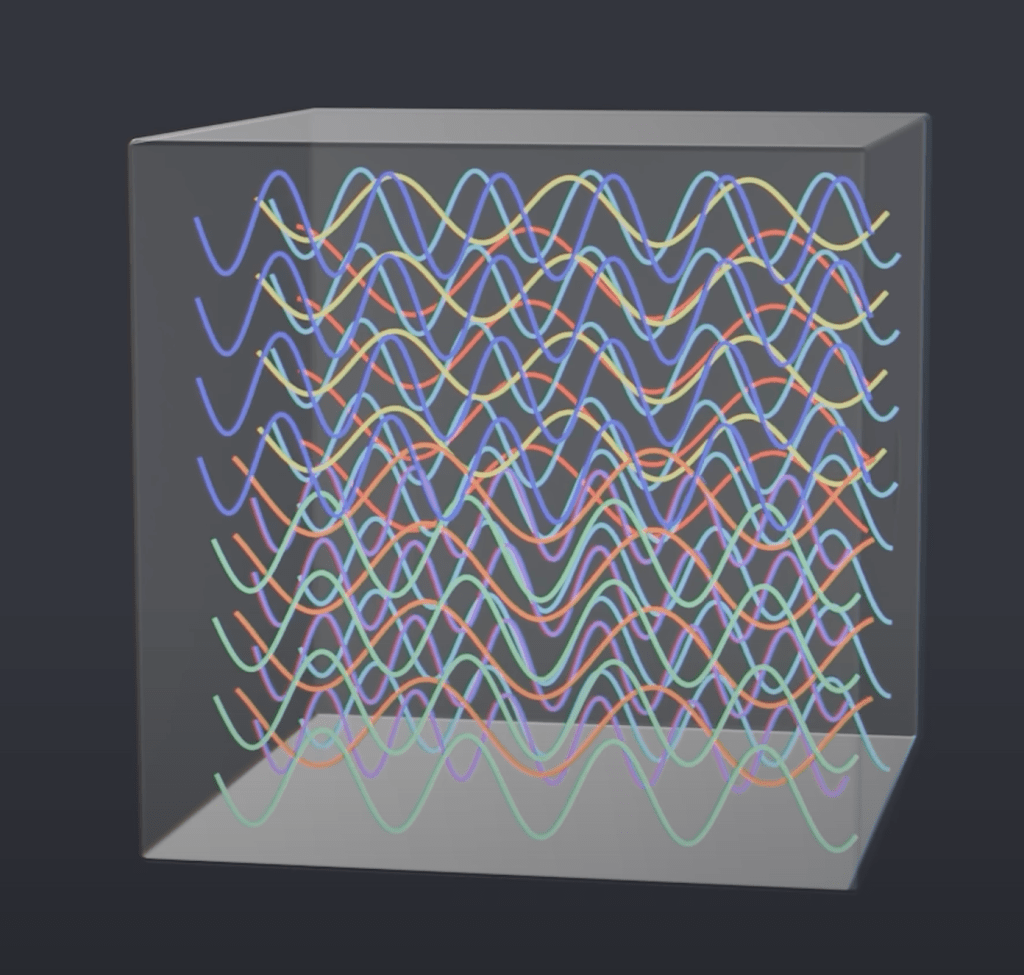
Here is the thing – our understanding of these waves is oversimplified. And the reason is we are forgetting a very real reality of nature – that the world operates in three dimensions, not two. All the understanding we had so far of standing waves was standing waves in two dimensions, not three. In one dimension, for any given frequency, only one mode of vibration is possible, which means that if the number of modes is n and frequency f, then –
n ∝ f
Imagine the number of modes of vibrations as the number of ways a wave can vibrate in nature. For any given frequency, only one mode is possible because we are vibrating a line. Example –
But in three dimensions, it’s not a line that is vibrating – it’s a plane. This means, for the same frequency, the vibration can happen in multiple modes. Here is a visual representation –

Did you notice it? For the same frequency, there are multiple modes of vibrations because in the plane, there are quadrants. These quadrants can vibrate in multiple ways, increasing the number of modes. A mathematical relation would be –
n ∝ f2
Now, for the same frequency, since there are multiple modes, there are multiple amplitudes. Even if the amplitude value is the same, the contribution from each needs to be counted. So the assumption that frequency does nothing to the wave energy is wrong, because now the same wave has higher energy because of more amplitudes embedded within the same frequency(Keep this in mind, because this will help us later). So the equipartition theorem fails, and the energy each wave has is not Eo.
In fact, for each wave, the higher the frequency or the lower the wavelength, the higher the energy and thus, the higher the intensity. So the curve is not a straight line parallel to the wavelength axis anymore; it’s different. Precisely, it is something like this –
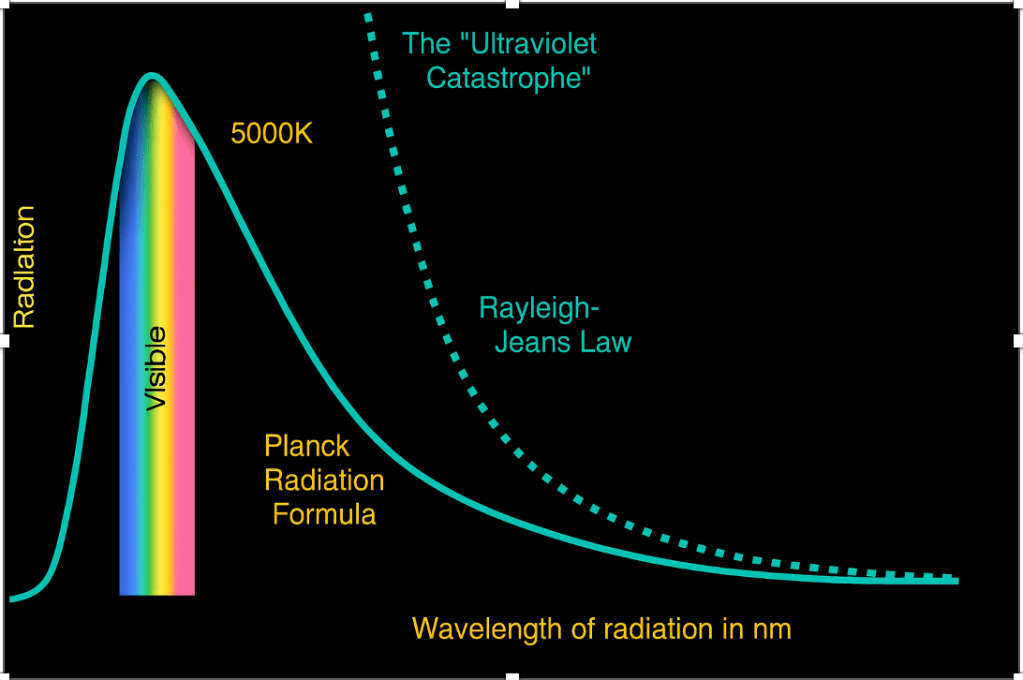
This is the ultraviolet catastrophe, as you can see from the dotted line. When the theory explained above was converted into a law, called the Rayleigh-Jeans Law, named after those who theorised it – Lord Rayleigh and J.H. Jeans13. The reason behind the word ultraviolet is that ultraviolet beams come at low wavelengths. What this meant was that the higher the frequency or the lower the wavelength, the higher the energy. At zero wavelength(meaning no light), an infinite amount of energy would be released according to this theory. This is why it was a catastrophe. The formula for the Rayleigh Jeans law is –
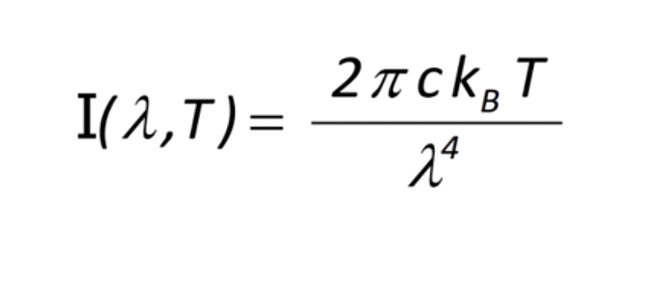
Here,
T = the temperature
C = the speed of light
Kb = the Boltzmann constant
The temperature dependence is because for any atom that vibrates to produce EM waves, the degrees of freedom it owns directly affect the energy it has, and the energy of the wave it produces, which is directly proportional to the temperature.
Now obviously, this formula and this theoretical explanation are wrong, because this defies both experimental results and common sense.
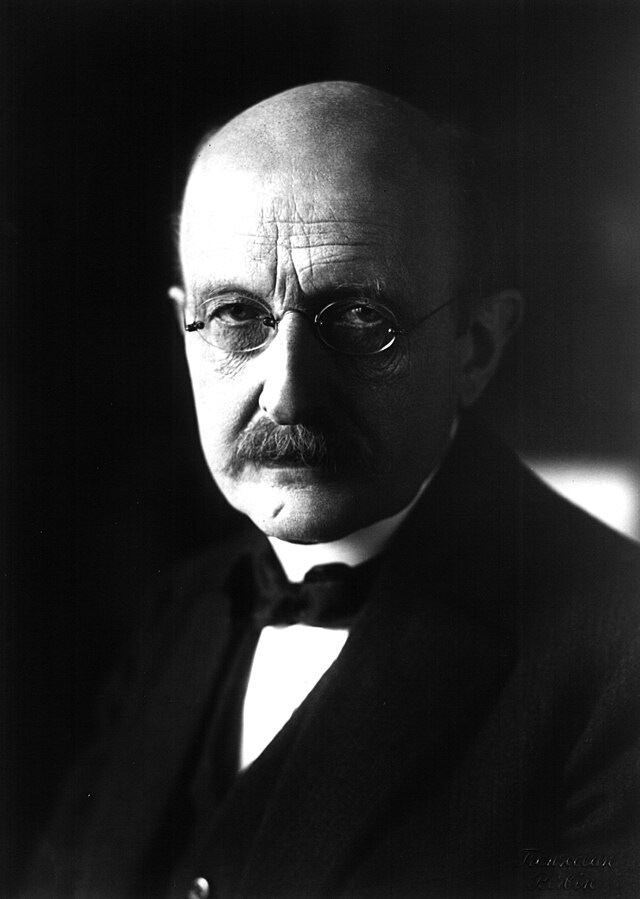
This is where the hero of the story comes in, who does something extremely radical – Max Planck.
§ Planck’s Counting Trick
The final part includes the amazing solution Max Planck gave to the problem of the ultraviolet catastrophe – a solution that opened the doors to a universe within our universe, which physicists are studying to this day. But Planck almost didn’t go into studying Physics.
When Planck was just 16 years old, he went up to his professor asking him for guidance, because Planck himself wanted to pursue a career in Physics. To this, his professor replied that Physics was essentially a “complete science”. There were only a few small notches here and there to be fixed; otherwise, everything was done, so Planck better find another field to pursue a career in.
Luckily, he did not listen and pursued Physics. By 1897, he was a Physics professor himself and then started his research on finding a theoretical model to perfectly showcase blackbody radiation. For 2 straight years, he tried every possible method he could find, but failed. And then in 1899, in an act of desperation, he did something unthinkable. He published this unthinkable idea on 14th December, 1900 – this idea then changed the world of Physics forever. So let’s begin.
Classical Physics says that energy comes in a continuous stream, like water from a pipe. Also, this energy, coming especially from waves, was a function of its amplitude, not frequency or wavelength. But Planck did something completely weird. He constricted the energy that was coming as a function of its frequency, and the energy being direct multiples of it – a quanta.
Therefore, the idea was that if energy is E and frequency f,
E ∝f
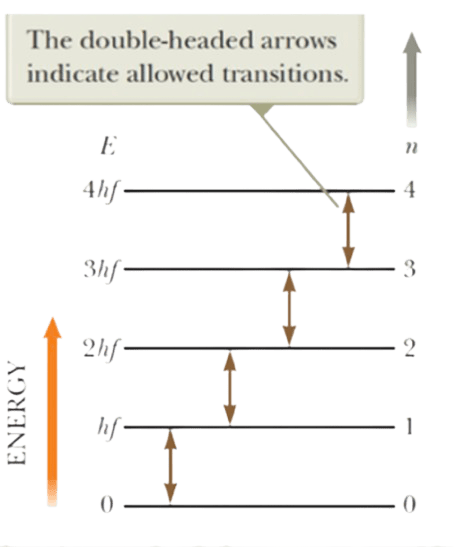
E = nhf
A way to understand this is by considering the following diagram. Here, it shows that every time an atom(or oscillator) would like to conduct a transition from one state to the other, it does so by dealing with energy in terms of a quantum, where each quantum is hf. So let’s say if an atom would like to go from the first state to the second state, it needs to gain energy, where the required energy is the difference between the energy of the assigned states. Meaning – Required energy = 2hf – hf = hf
In this way, the atom gains hf amount of energy, jumps to the second state, and thus now has 2hf energy. Similarly, in order to go from the first state to the third state, the atom needs 2hf energy, and thus has 3hf energy in the final state.
If an atom wants to go from the third state to the first state, it needs to release energy. Meaning, the atom now needs to release 2hf energy to reach the ground state. This transition is what results in the atom releasing energy in terms of quanta, which we then measure.
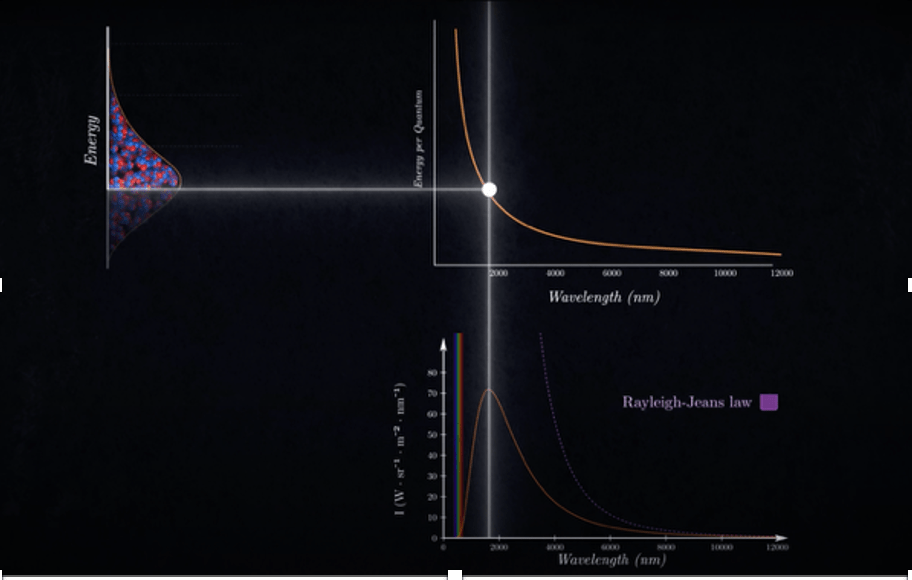
Now let’s apply this. In any black body, some atoms have very little energy, some have a lot, and most have somewhere in between. If you analyse, as the wavelength reduces or as the frequency increases, the curve goes up because we are moving from atoms having low energy to atoms having higher energy. The curve peaks for that wavelength at which the maximum number of atoms have that same frequency(associated with the wavelength). But beyond that peak, the number of atoms drops, even though the energy per atom rises. As a result, the overall intensity of those high-energy atoms is lower because the number of atoms is simply very low. Thus, the curve drops and eventually goes to zero when no atoms are left for very high energy. This exactly matches the experimental graph. All that was left was plugging in Planck’s idea and creating a new equation, one that connected theory with experiment.
Now, you may seem confused as to how this works. At the end of the day, this was nothing more than a counting trick. And this is why Planck was too worried – it was purely formal. He did not know what ‘h’ in E = nhf represented physically; all he knew was that it worked.
Although Planck’s work gave hints towards Quantum physics, he disregarded it as the true picture of nature. Even after publishing his paper, which worked on the principle of quantisation, he was still a strong advocate of the fact that energy came as a continuous spectrum, not in discrete packets.
Now, if we try to understand the original findings of PTR scientists as to why objects at and above 500°C showed a similar distribution of radiated light regardless of chemical composition, it is because a lower temperatures, atoms vibrate because of their own properties and because they are in the vicinity of other atoms. So the radiated EM waves are due to the waves they produce. But at very high temperatures, the atoms vibrate mostly due to the high temperatures. And the vibration is so vagarious that their individual characteristic vibration is blurred out, and the object now starts behaving like a black body, forming standing waves and shifting the peak of the Wien displacement curve to the left, near the visible region. As a result, the emitted EM waves can now be seen with the naked eye, with the most common emitted colour being red, orange, or yellow(like with extremely hot iron or any other metal).
But the problem of quantisation was still there. And this was solved by a patent clerk, but not just any patent clerk.
This was Planck’s formula –
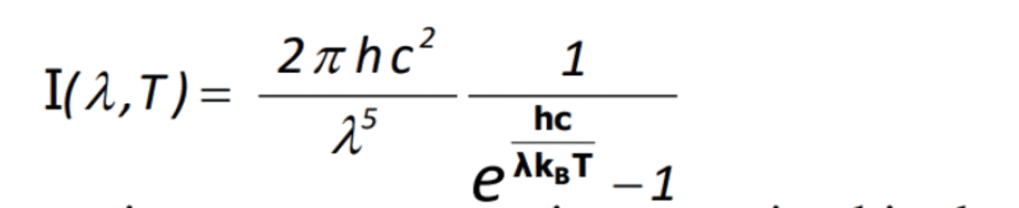
Intensity changes nothing
§ Hertz’s experiment
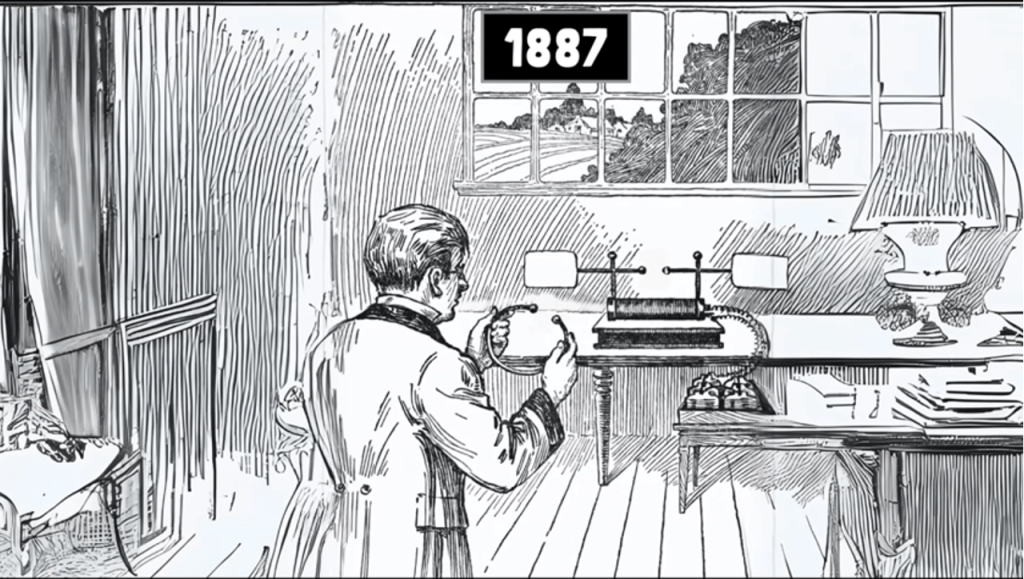
In 1887 and 1888, Heinrich Hertz, a German Physicist, conducted experiments to prove Maxwell’s theories of electromagnetic waves. Maxwell theoretically predicted that when a charge is moving, the constantly changing electric field through any interface results in the formation of magnetic fields, and those magnetic fields produce electric fields in turn, and the process continues. Therefore, as long as the charge moves, these electric and magnetic fields will be produced, each perpendicular to the other. Maxwell called them electromagnetic (EM) waves.
Hertz’s setup was simple. He connected a very strong inductor coil to two brass spheres separated by a very small(around 3mm) air gap. From this apparatus, a few metres away, he placed a circular wire made of copper with a small break in the wire.
The idea is that if Maxwell’s theories are true, then when the inductor is turned on, it will produce a spark between the brass spheres. As a result of this spark, EM waves should travel from the brass sphere to the wire, producing another spark in the break of the circular wire and completing the circuit. Now, you cannot really control the direction of the EM wave, so you have to assume it travels in every direction, and thus the intensity of the spark in the wire would be lower than that in between the brass spheres. And all of this did indeed happen!
Hertz also made two key discoveries, almost by accident, while conducting his experiment –
1. The intensity of the spark and the spark length increased when he shone ultraviolet light on the circular coil.
2. The spark length decreased when he experimented in a dark room
Hertz never really stumbled upon the reasons for this. Nevertheless, this phenomenon, where shining light on the ring increased the spark length, was named the photoelectric effect.
Luckily, his former student and lab assistant, Phillip Lenard, would come up with theoretical explanations for both of these discoveries Hertz made.
§ Lenard’s findings and the trigger hypothesis
By the time Lenard came onto the scene, the electron had been discovered by the famous Physicist J.J. Thomson in 1897 by using the cathode ray tube.
Here is how it works –
Take a glass tube and empty it to form a near-perfect void. As a result, the pressure inside the tube should be very low. Take two metal plates and attach them to the corners of the tube. Now connect the plates with a very high voltage battery (2,000V to 5,000V), such that one side becomes the cathode and the other the anode. Behind the anode on the glass edge, put a fluorescent coating, typically made of ZnS. Also, make a small hole in the metal anode.When the battery is turned on, the ZnS coating shows fluorescence. The only possible explanation is that negative charges flew from the cathode to the anode, passed through the hole, and made the coat shine. The charges were negative because the electric field points from anode to cathode in any circuit, and negative charges move opposite to the electric field.
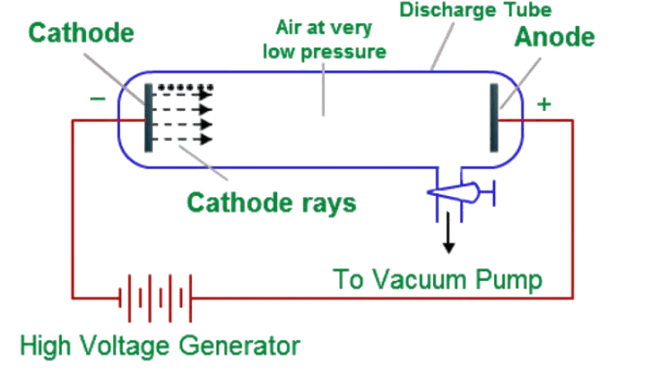
An interesting observation was that the material of the metal did not matter – the same amount of fluorescence was produced every time. This means that the negative particle was in every atom. This particle was called the electron. The explanation was that after the battery was turned on, the extremely strong electric field overcame the electric field between the electron and the nucleus, ripped it off the atom, and accelerated it to the anode to pass through the hole and result in fluorescence.
Now, back to the photoelectric effect. With the information about electrons, he knew what the spark of Hertz’s experiment actually represented in the real world. It was a stream of electrons. So the way he put it was –
Every time light shines on a piece of metal, it is absorbed by the metal, and as a result, the atoms inside the metal lose their electrons in the process. This is the photoelectric effect.
Now obviously, he wanted to find out the particulars of this effect – what affects it, how it works in the first place, and how it can be used in the real world.
But how do you even do this? I mean, you can’t see the electrons, and to measure their energy, I can’t just put my hand in place to stop it – but wait, you can!
See, Lennard’s idea to measure the energy was that, let’s say, a baseball is headed towards you. It obviously has kinetic energy because it has a velocity. But, you can’t really figure out its velocity as it’s moving or coming towards you – it’s just not possible. What you can do is, is to place your hand in its direction to stop it, just like the way we do when we try to catch the ball. Now, the harder the force we feel on our hand, the more energy the ball had in the first place, and the more velocity it had. This is exactly Lennard’s idea.
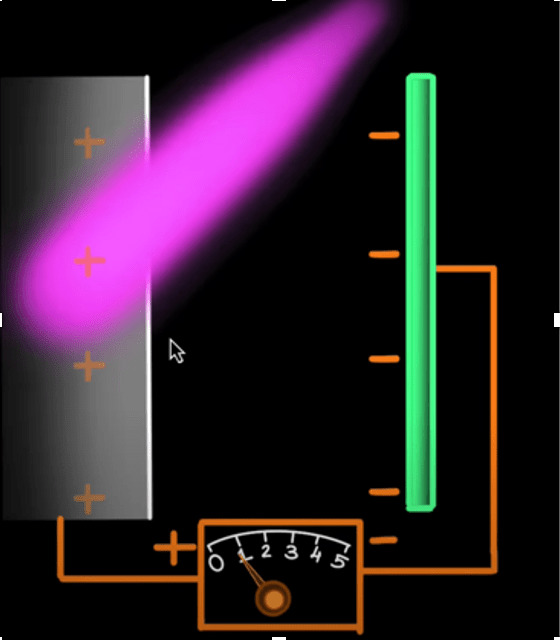
Take two metal plates. Connect them via an electrical wire and a battery in between. Almost instantly, the polarities of the battery will extend out to the plates, making one positive and the other negative. It will look something like this –
Now, when you shine a light on the positive plate, the photoelectric effect will take place, and electrons will be ejected. The ejected electrons will move away from the positive plate or towards the negative plate. Now, if the energy of the electrons is stronger than the negative field on the negative plate, the electrons will reach the plate and pass through the wire, completing the circuit. To confirm this, one can install a galvanometer, which is a device that deflects on detecting a current. If there is no current, there is no deflection. This is the updated circuit –
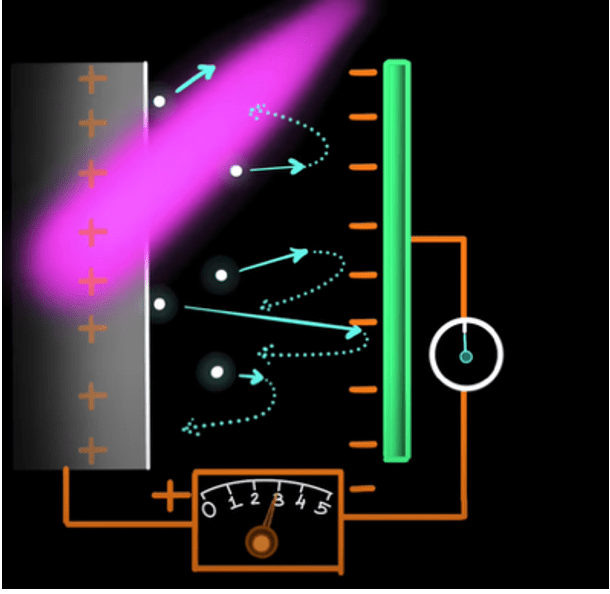
The blue dots are the electrons that get removed and deflected from the negative plate. Now, they come back to the logic of baseball. Depending on how much force the negative plate feels, we can determine the energy of the electrons. So, we increase the value of the voltage from the battery until the galvanometer shows no deflection. This means the current is not there, or the negative plate successfully deflected every single electron headed towards it. The second the deflection is zero for the galvanometer, the voltage of the battery is the energy of the electrons themselves!
We can simply calculate the actual energy of the electrons by multiplying the constant e by the voltage V, giving us the energy –
E = eV
Where e = 1.6 * 10-19C, which is the charge on one electron.
Now, we have found the energy of electrons ejected from the metal for a given light. What if we change the nature of the light itself? See, Lennard was a firm believer in the classical theory and never embraced the quantum world, much like Planck. He believed that the intensity was what would change the energy of the electrons ejected, for the apparatus does nothing else than measure it. So, he increased the intensity of the light.
And boom, intensity changed nothing.The energy of the electrons was still the same. What Lennard did find out was that the number of electrons ejected increased as he increased the intensity of light, but not the energy of individual electrons themselves. Meaning, at E = eV, the galvanometer still showed zero deflection, but the deflection was even higher than before at a voltage lesser than V, because now more electrons than before were making the gap and reaching the negative plate to complete the circuit, simply because there were more electrons ejected in the first place.
Now he needed an explanation for this weird phenomenon, that the intensity did not increase the energy of the electrons. And the reasoning he came up with was absolutely brilliant.
Imagine a cannon, the old ones where there is a barrel with gunpowder filled inside it, the cannon shell loaded in the front, and a small fuse rope connected to the gunpowder poking out of the opposite end of the barrel. Like this-

Here, you light a fire on the fuse, which goes to the gunpowder, igniting it and pushing the cannonball (blue here) ahead.What Lennard said was that the size of the flame does not matter. You light the fuse with a matchstick, a lighter, or a flamethrower; what difference does it make? In each case, the size of the flame only gets bigger, but that does not change the energy or velocity of the ball ejected. All three fires ignite the gunpowder in the same way and eject the balls in the same way. The fire is only there to trigger the reaction.
Lennard thought the photoelectric effect worked in the same way. The intensity only increases the size of the flame, but that does not change the mechanism of ejecting the electron. The energy stays the same. More electrons for a higher intensity can be imagined as there being multiple cannons that get triggered by the same big flame, all ejecting electrons at the same energy.
This was called the trigger hypothesis.
Now this was a brilliant analogy to clear up all problems, except one. When Lennard tested these theories with multiple lights, each of different colours(meaning different frequencies), he found out something weird. Since the classical theory predicts the energy of a light is only dependent on intensity, he assumed the frequency would change nothing. But, it did. Higher frequency lights like X-rays produced way more electrons than those in, say, the visible spectrum.
Now, how do you explain the fact that frequency actually increases the energy of the electrons ejected? Well, this is where a patent clerk comes in.
references
§ books
- The Feynman Lectures on Physics: Mainly Mechanics, Radiation, and Heat – Richard Feynman, Robert B. Leighton, and Matthew Sands
- The Feynman Lectures on Physics: Quantum Mechanics – Richard Feynman, Robert B. Leighton, and Matthew Sands
- Physics for Scientists and Engineers with Modern Physics – Raymond A. Serway and John W. Jewett, Jr
- Principles of Physics: 10th edition – David Halliday, Robert Resnick, Jearl Walker
§ documents
- https://www.britannica.com/place/Prussia
- https://www.caluniv.ac.in/academic/History/Study/IR-Germany-2.pdf
- https://www.gaslicht-ist-berlin.de/fileadmin/gaslicht-berlin/content/aktionen/pdf/Burman_Report.pdf
- https://www.tuev-nord.de/explore/en/remembers/a-brief-history-of-energy/
- https://assets.new.siemens.com/siemens/assets/api/uuid:782bbeff44b427c909de6feeaa67625f2959365b/001-biography-werner-von-siemens-201604.pdf
- https://www.britishtelephones.com/histsie.htm
- https://en.wikipedia.org/wiki/Kaiser_Wilhelm_Society
- https://www.ptb.de/cms/en/about-us-careers/about-us/history-of-ptr-and-ptb.html
- https://www.ptb.de/cms/fileadmin/internet/presse_aktuelles/broschueren/geschichte_ptb/PTR_and_PTB_History_of_an_Institution.pdf
- https://www.britannica.com/biography/Wilhelm-Wien
- http://arxiv.org/pdf/2208.06470
- https://article.scirea.org/pdf/140620.pdf
§ youtuber references
- Credits to Floathead Physics – https://www.youtube.com/@Mahesh_Shenoy
- Credits to Veritasium – https://www.youtube.com/@veritasium

Leave a comment